2018 October - December
6.3 Bixby Developer Studio Release Notes
Updated: Dec 14, 2018
In this release, we didn't release any major features, but we did fix a number of bugs!
6.2 Bixby Developer Studio Release Notes
Updated: Nov 27, 2018
6.2 Bixby Developer Studio Updates
Preview Tabs
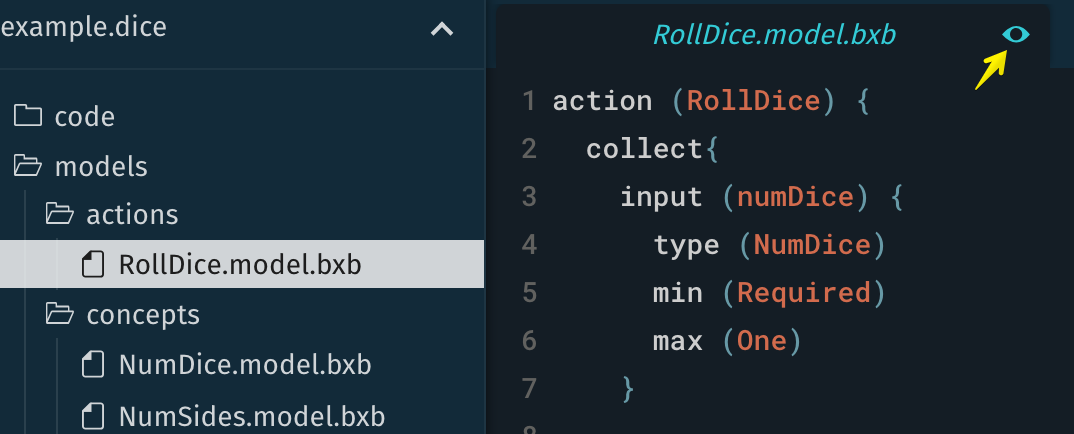
With this release, capsule files are previewed within a single tab instead of separate tabs. When you double-click or start to work within that tab, the tab becomes a normal tab, and a new one opens if you open another file. This allows you to open and view more files within Bixby Studio without cluttering your workspace.
You know when you are previewing a tab by the "eye" icon in the tab, which will disappear once the tab becomes a permanent tab:
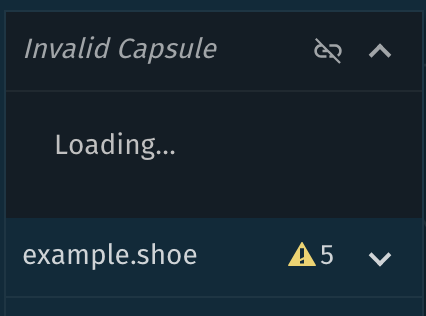
Capsule Validation
Bixby now validates capsules when you open them. Here's an example of a corresponding error:
Sync Limit for Capsules
You are now limited to syncing five capsules. You can continue to add capsules, but Bixby will only sync the first five. You have the option of selecting any five capsules that you add.
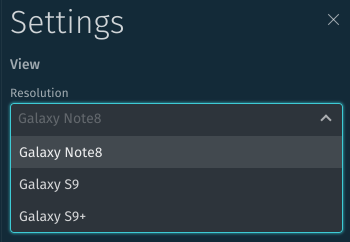
Simulator Options Now Match Capsule Targets
When you change your capsule target, such as bixby-mobile-en-US, the Simulator now automatically provides matching device types and selects the first one.
For example, the spaceResorts capsule below has targets that support mobile devices:
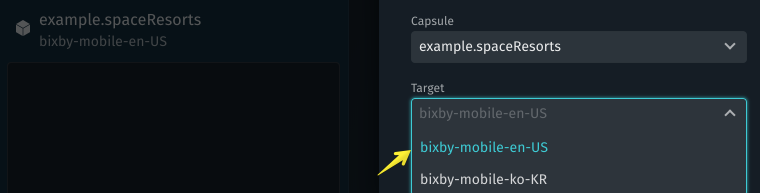
The resulting options for the Simulator now match that target:
6.2 Toggle for Showing Imported Library Executions in the Debug Console
Within the Debug Console, you can now toggle whether the Debug Console considers imported library capsule executions when showing the execution graph.
Stories Bug Fixes
We've fixed a number of bugs and made refinements to Stories.
6.1 Bixby Developer Studio Release Notes
Updated: Nov 1, 2018
6.1 Bixby Developer Studio Updates
Bixby IDE is now Bixby Developer Studio!
We've updated the name for what was previously called the Bixby IDE. It's now called Bixby Developer Studio, or Bixby Studio in short form.
Shorthand Support with Auto-Complete
Bixby Studio now supports auto-complete when using shorthand (using the : child selector)

Submission Restrictions Update
You can no longer submit capsules unless you have the necessary permissions (you are a team member and a capsule collaborator). Bixby will also prevent you from submitting capsules that have special namespaces.
For more information on capsule permissions, read Manage Capsules in the Using the Developer Console documentation.
6.1 Debug Console Updates
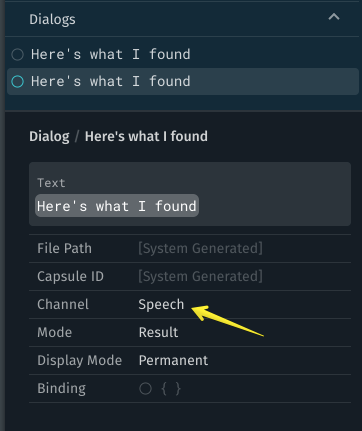
Speech Channel
If you have specific template text for spoken words, you can now debug it using the Speech channel within the Dialog X-ray pane:
Updated Plan Graph with Zoom
We've further refined the plan graph, which now supports zoom.
6.0 Bixby Developer Studio Release Notes
Updated: Oct 8, 2018
6.0 Bixby Developer Studio Updates
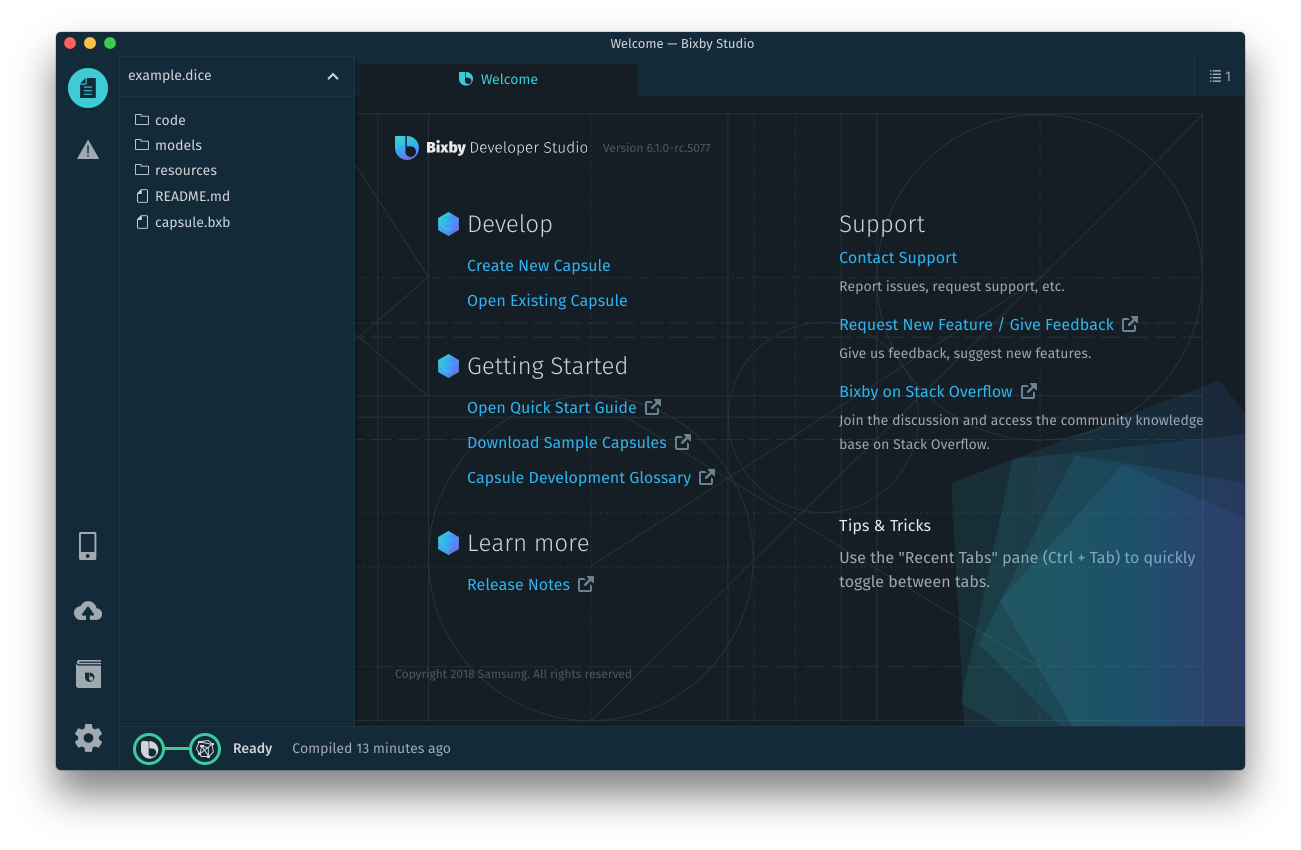
New Theme
We're excited to unveil a new theme that gives Bixby Developer Studio a fresh, new look. It comes with a new welcome tab (also available through the About Bixby Studio menu option) that gives you shortcuts and links to help you get started with Bixby. We hope you like it!
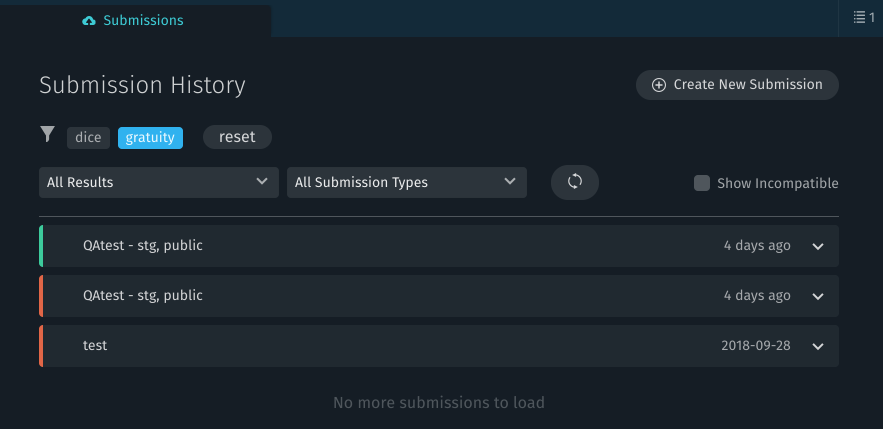
New Submissions Interface
With this release, the Submission interface has been redesigned and is now accessible in the lower-left corner of Bixby Developer Studio, or using the keyboard shortcut (Ctrl+ 8 or Cmd + 8).

You can now easily filter and sort submissions by choosing among public, private, accepted, rejected, and release submissions. You can also select specific capsules to see corresponding release submissions.
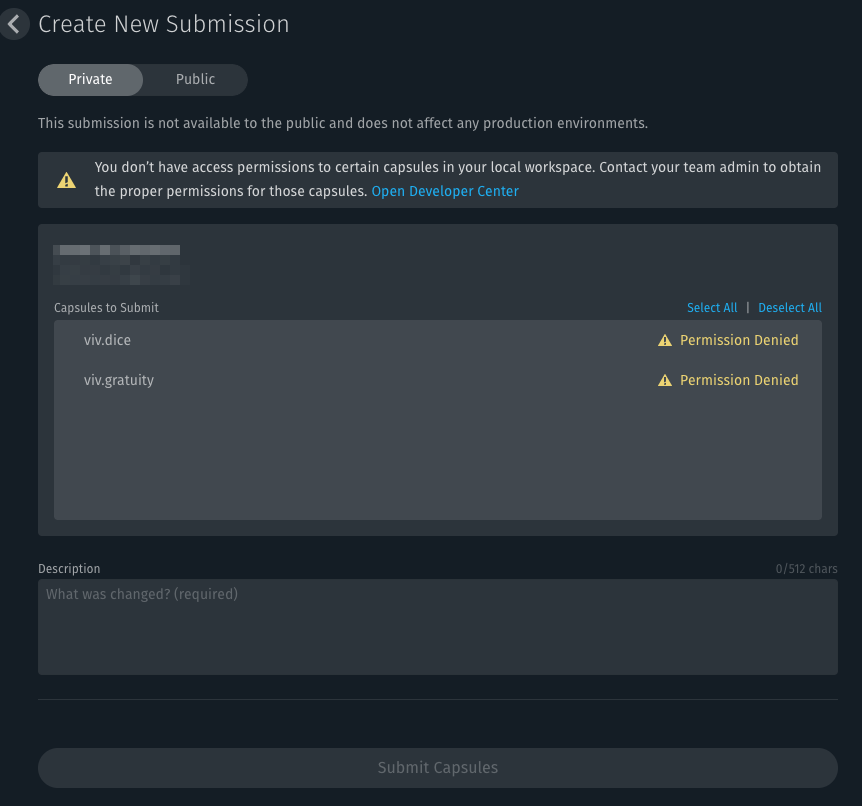
We've also refreshed the interface for creating new submissions. It now warns you if you don't have access permissions for capsules that you are submitting.
6.0 Debug Console Updates
The Debug Console has been updated with a refreshed look. It now shows input groups differently than other nodes. If you click on a node, it now automatically opens and highlights the relevant portion of the X-ray Pane: