
Introduction to Sample Graphs
About Sample Graphs
Sample graphs are various example action flows you can explore to learn more about the various voice intents, nodes, and SmartThings capabilities available in Bixby Home Platform. Additionally, you can use these sample graphs as starter points for your own devices!
Each sample graph is meant to generically handle specific capabilities covered under various user utterances through the various voice intents. For example, the Turn On Device sample graph will work for any device and covers a variety of user utterances such as "Turn on air conditioner", "Turn on fan", "Turn on speaker", and so on. This way, you can find the general use case that you need and not have to worry about it being tied to a specific device.
The sample graphs include inline node comments to help explain execution flows.
Check the SmartThings Capabilities reference for the various voice commands that are supported for each capability.
Copy the Graphs From Bixby Developer Center
If you decide to use a graph, you can copy the graph information as JSON and paste it directly into Bixby Home Studio (BHS):
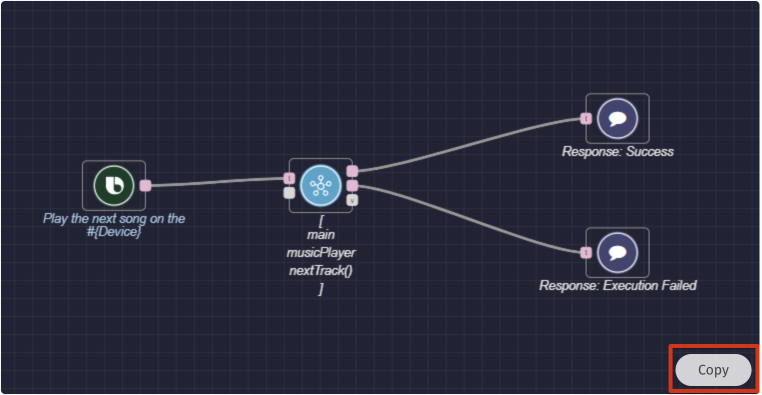
- Navigate to the sample graph you'd like to use.
- Click the Copy button on the bottom right corner of the graph. This copies the sample graph information to your clipboard.
- Open BHS.
- If you haven't already, set up a new voice intent under the Metadata profile of your device. (For more information, see How to Use the Editor).
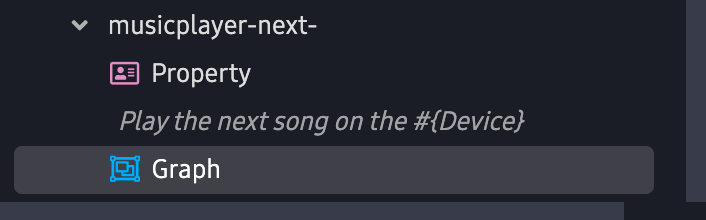
- Navigate to the voice intent where you want to add the graph.
- Click on the Graph link under that voice intent.
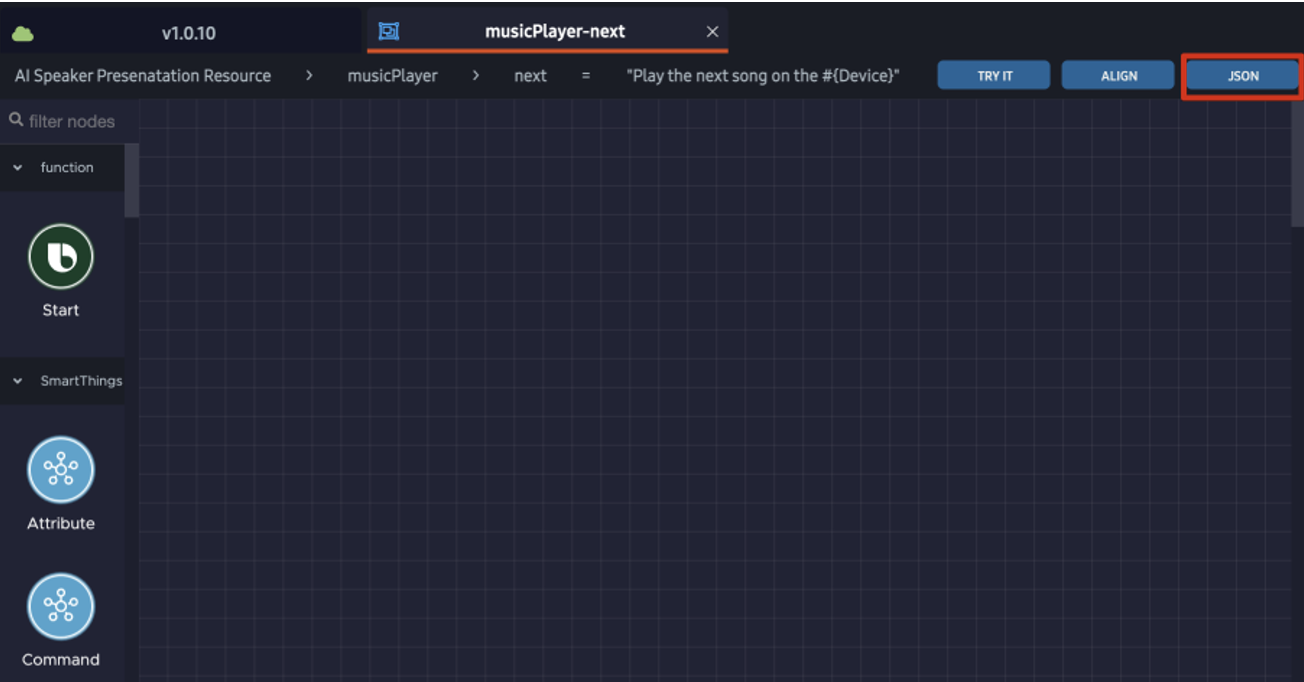
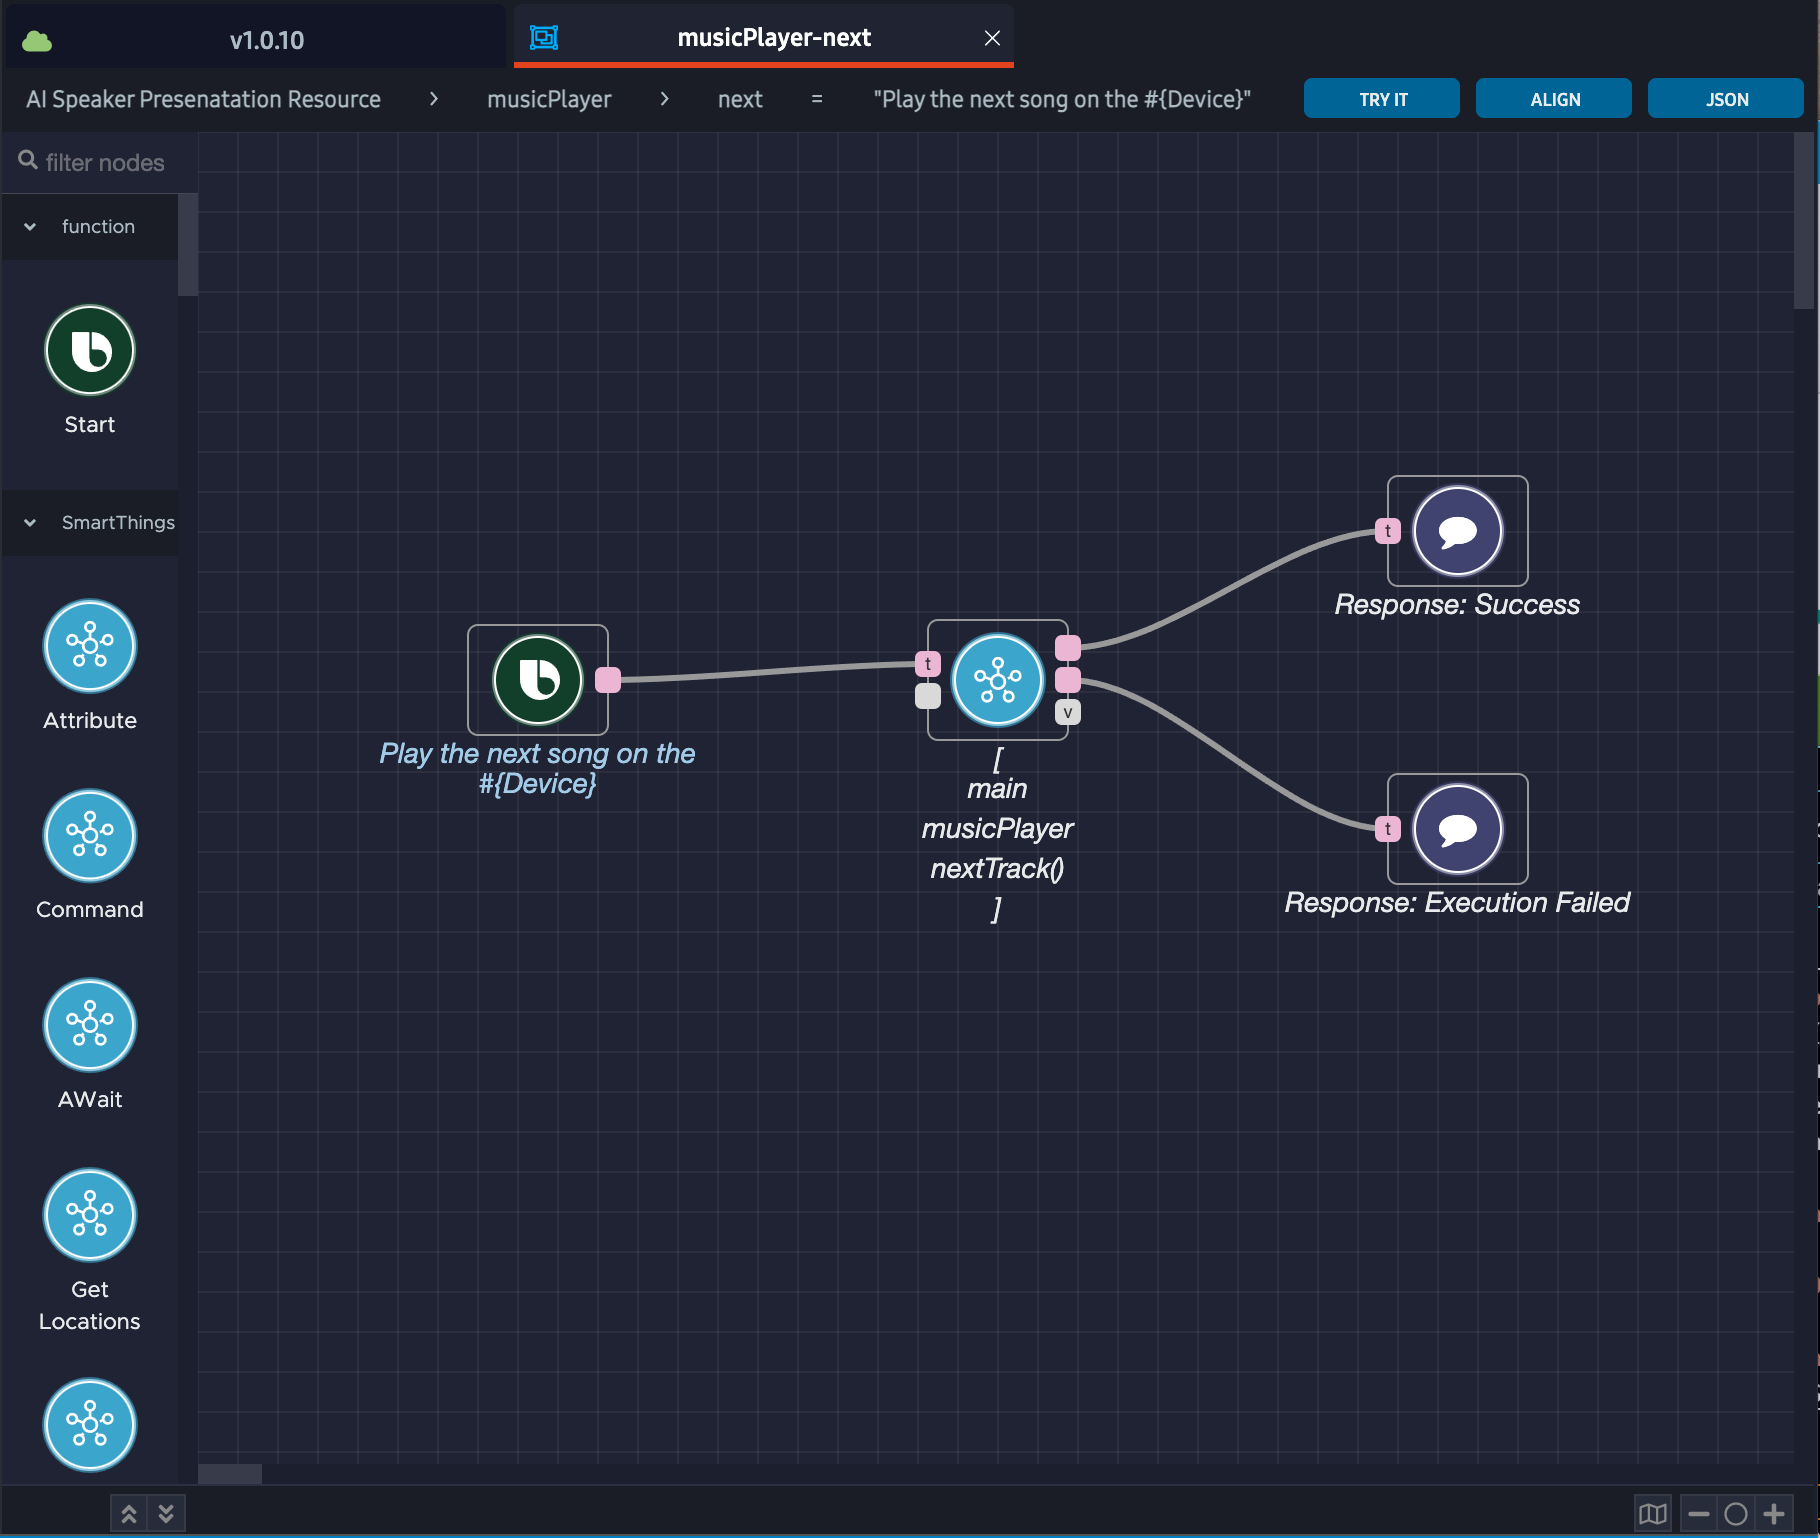
- Click the JSON button in the upper right corner of the editor.
- Paste the sample graph into the Load Graph JSON window.
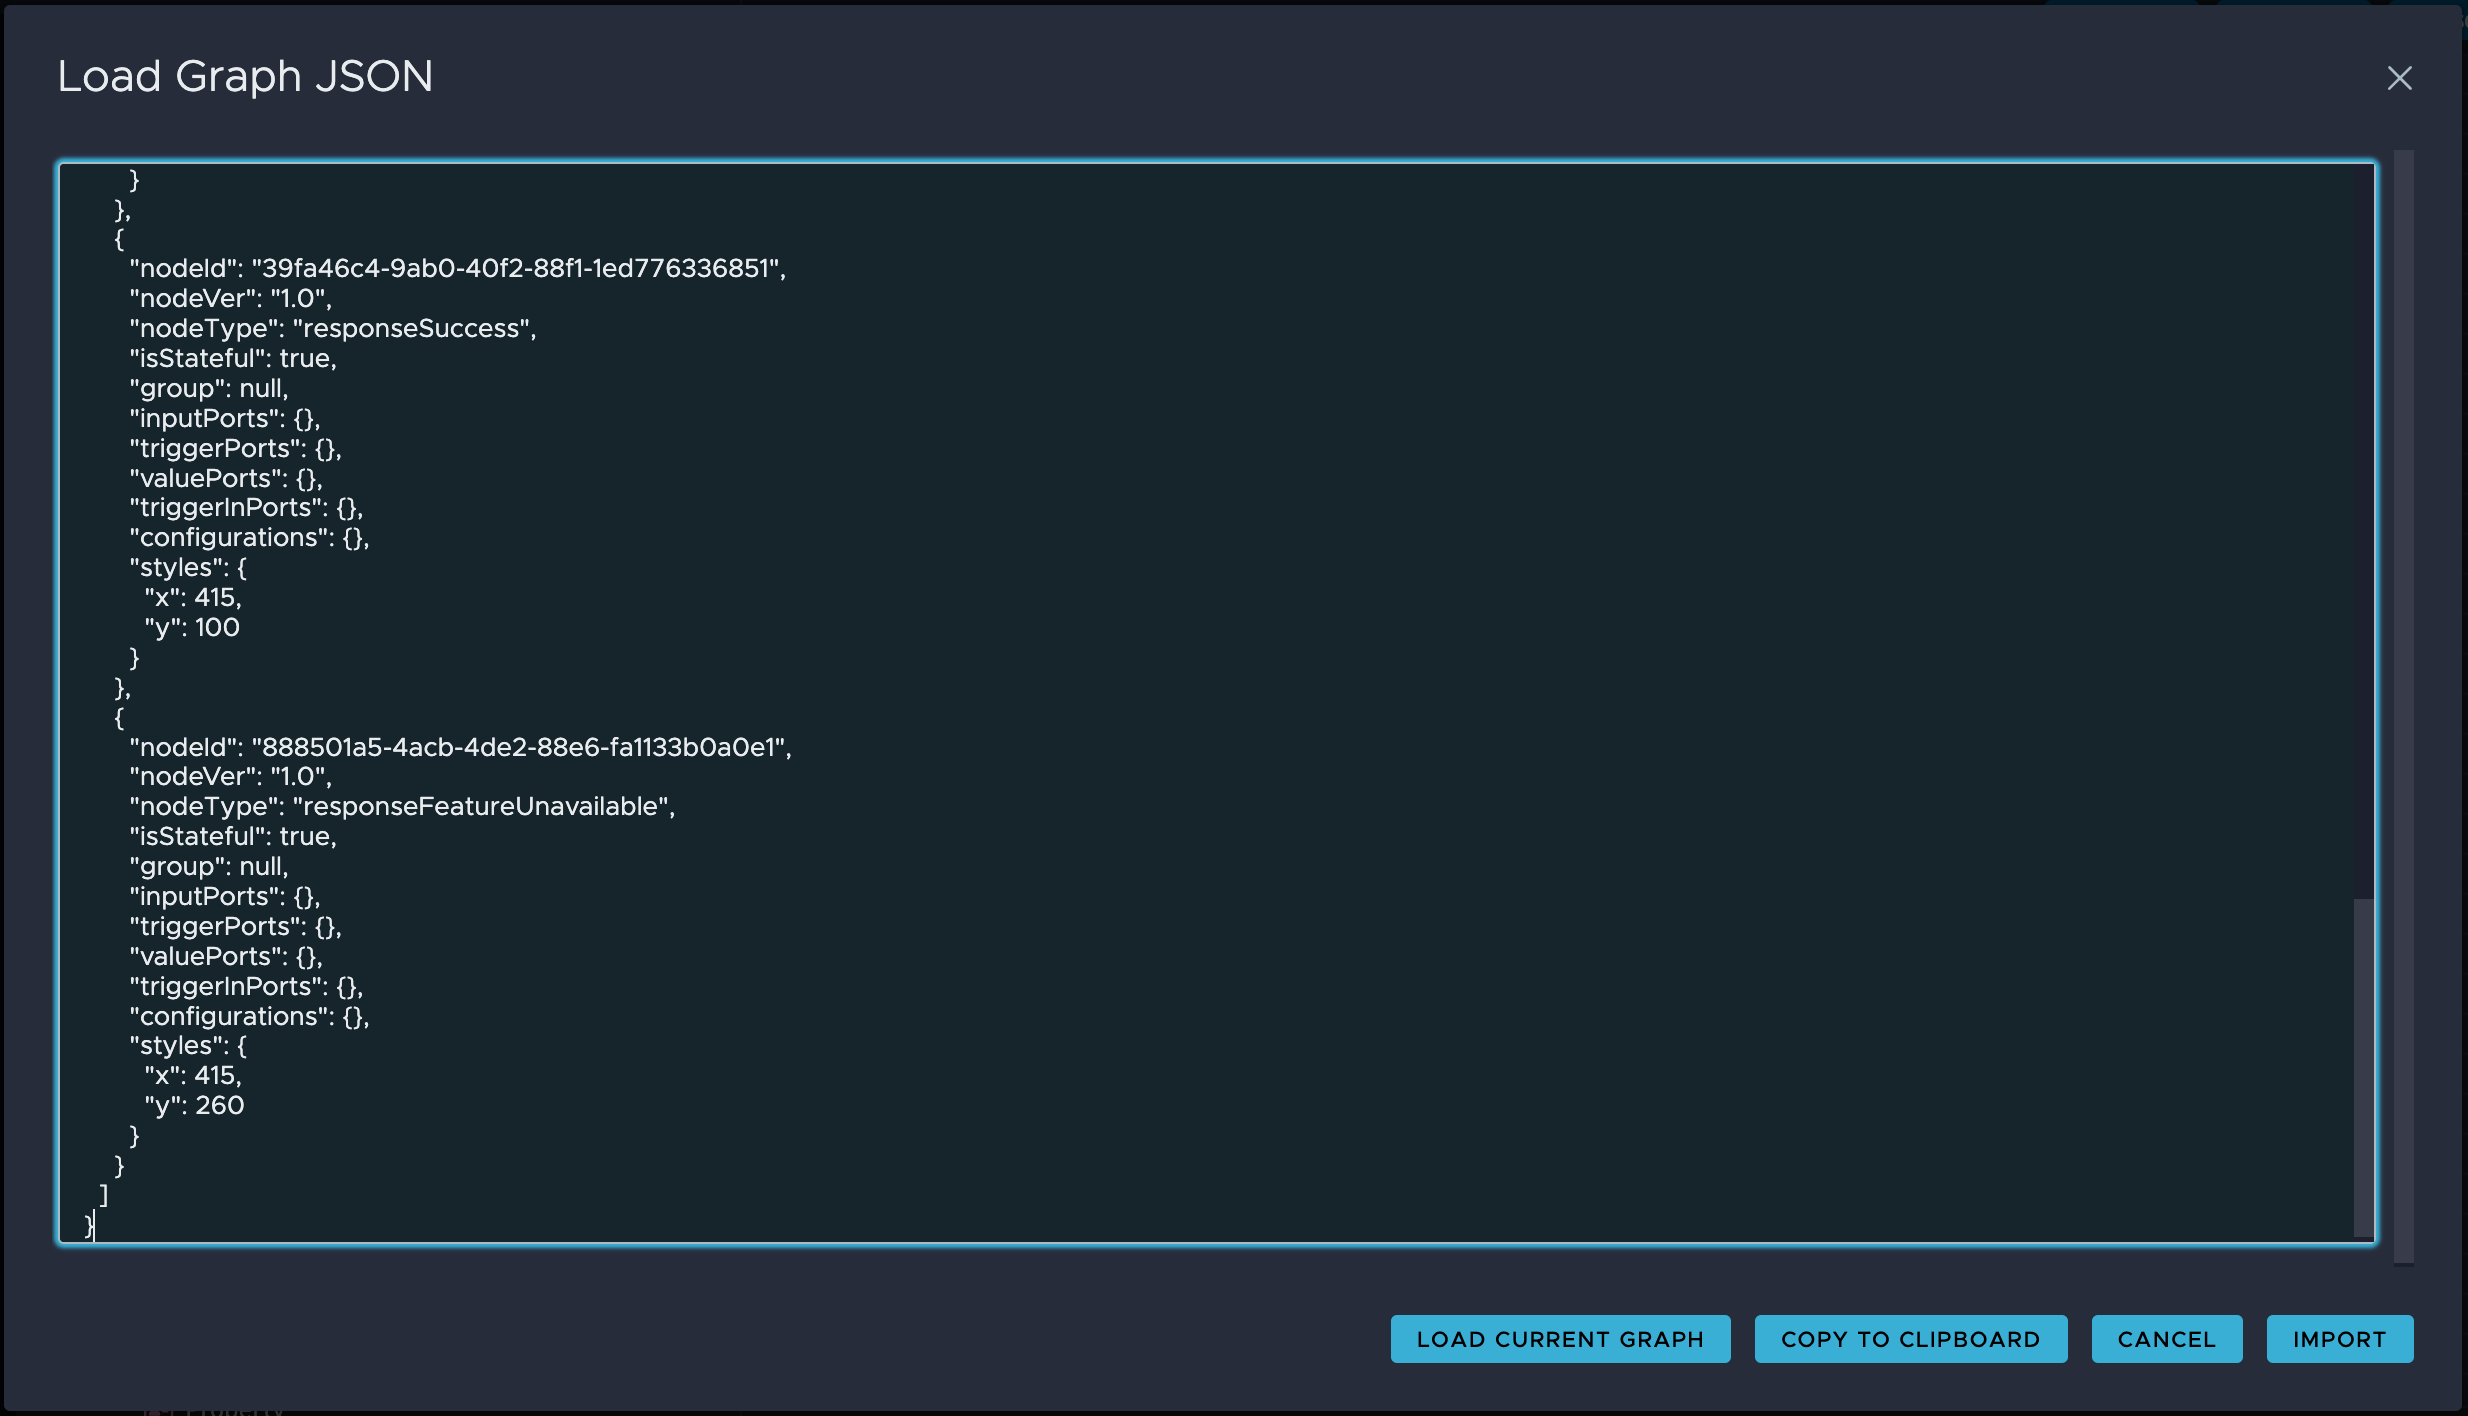
- Click Import. This imports the JSON file into BHS and loads it as a graph into your own metadata file.
Now you have a graph you can use in your own metadata! You can modify the graph as needed as well.
Use the Graphs Within Bixby Home Studio
You can also use the sample graphs that are directly integrated in BHS.
To view the various sample graphs, click the Sample Graphs button ![]() in the left sidebar menu.
in the left sidebar menu.
If you want to use one of the sample graphs, do the following:
- If you haven't already, set up a new voice intent under the Metadata profile of your device. (For more information, see How to Use the Editor).
- Navigate to the voice intent where you want to add the graph.
- Click on the Graph link under that voice intent.
- Click the Sample Graphs button in the left sidebar menu to show all the available sample graphs.
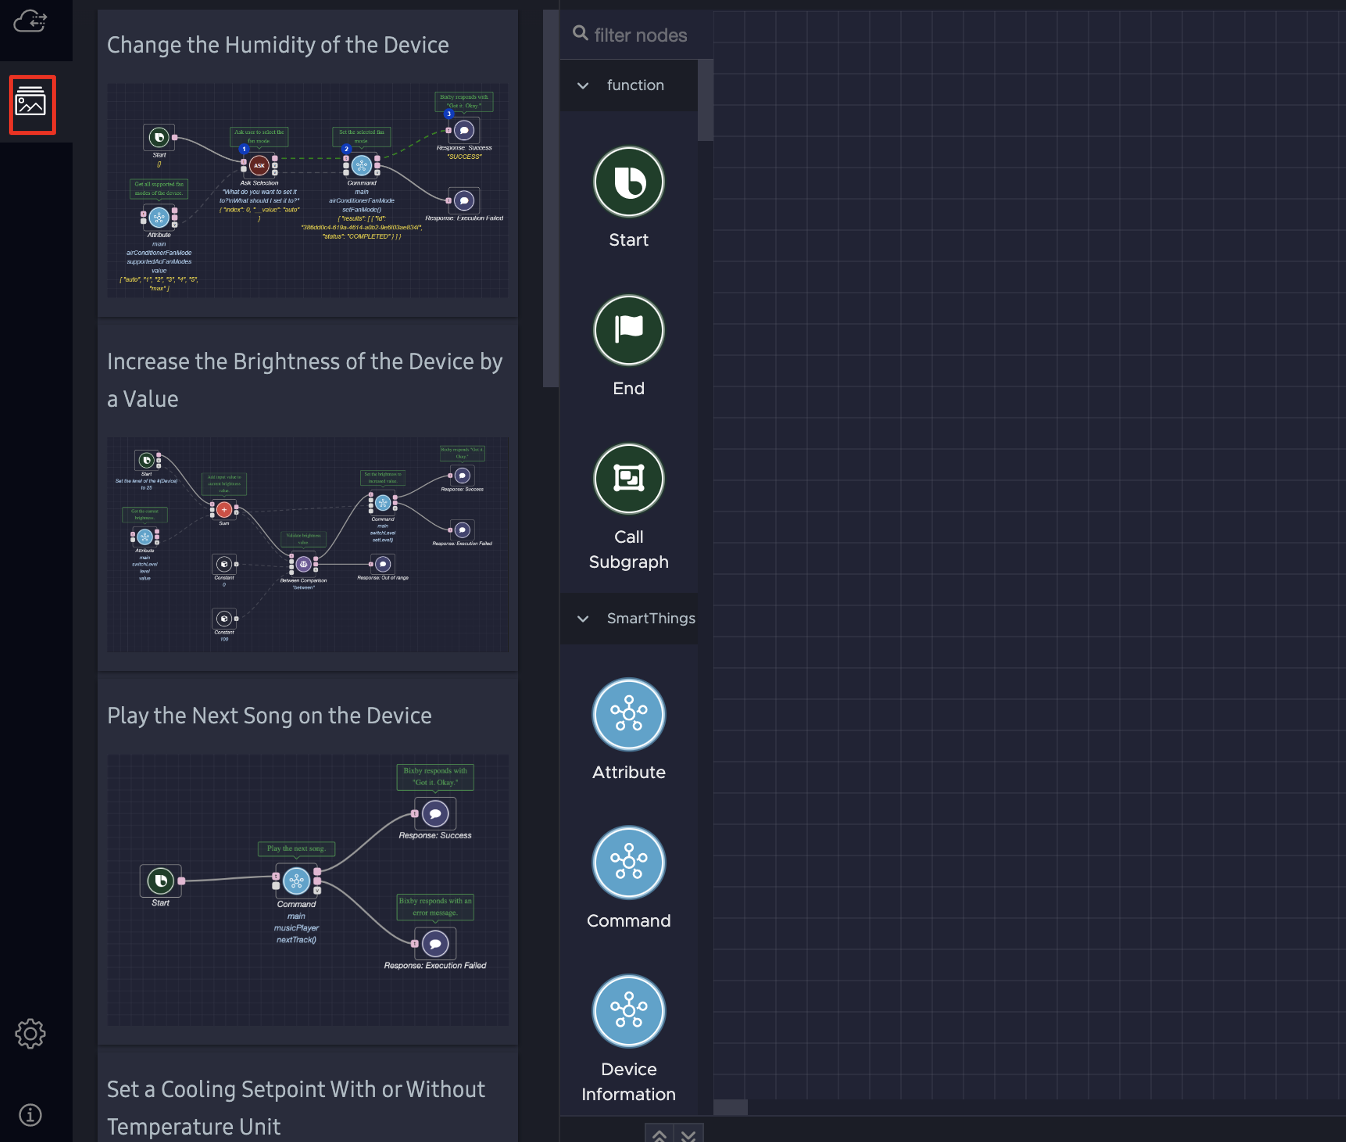
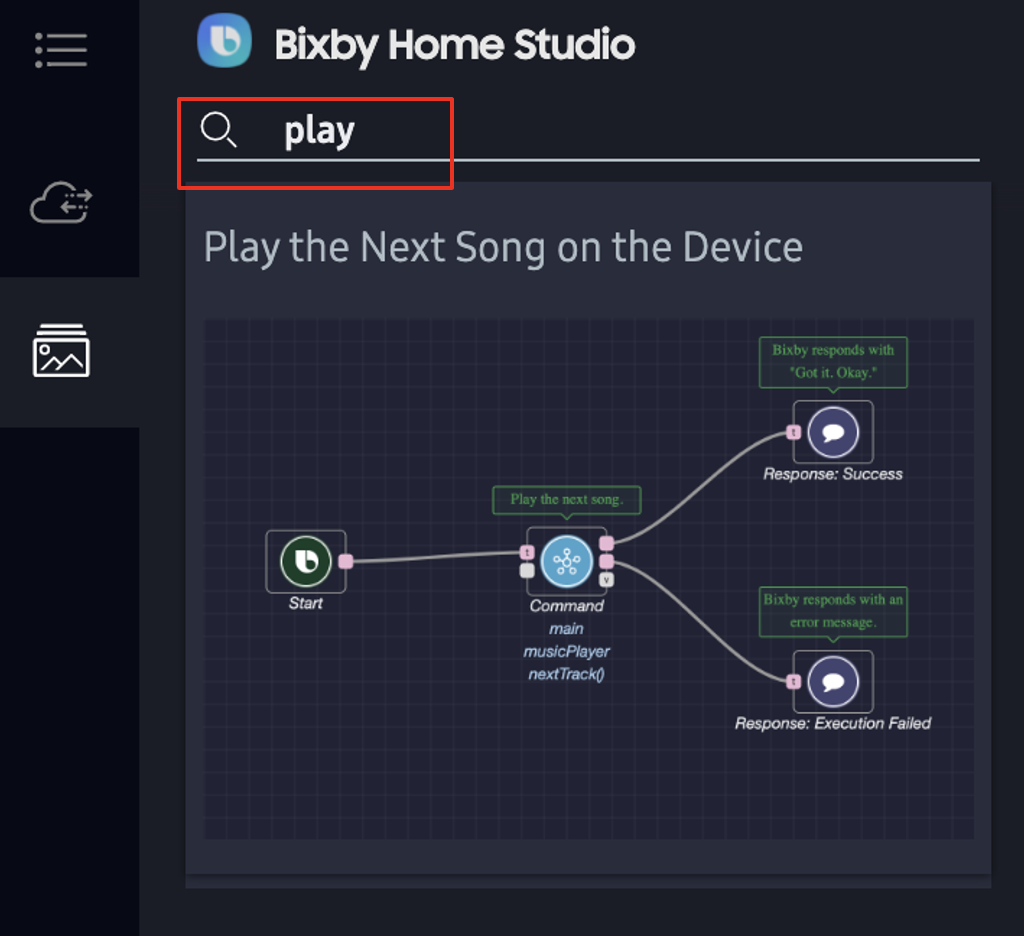
- Find the sample graph you want to use. You can either scroll through the sample graphs or filter the results by searching for the specific graph in the search bar:
- Drag and drop the sample to the Editor pane.
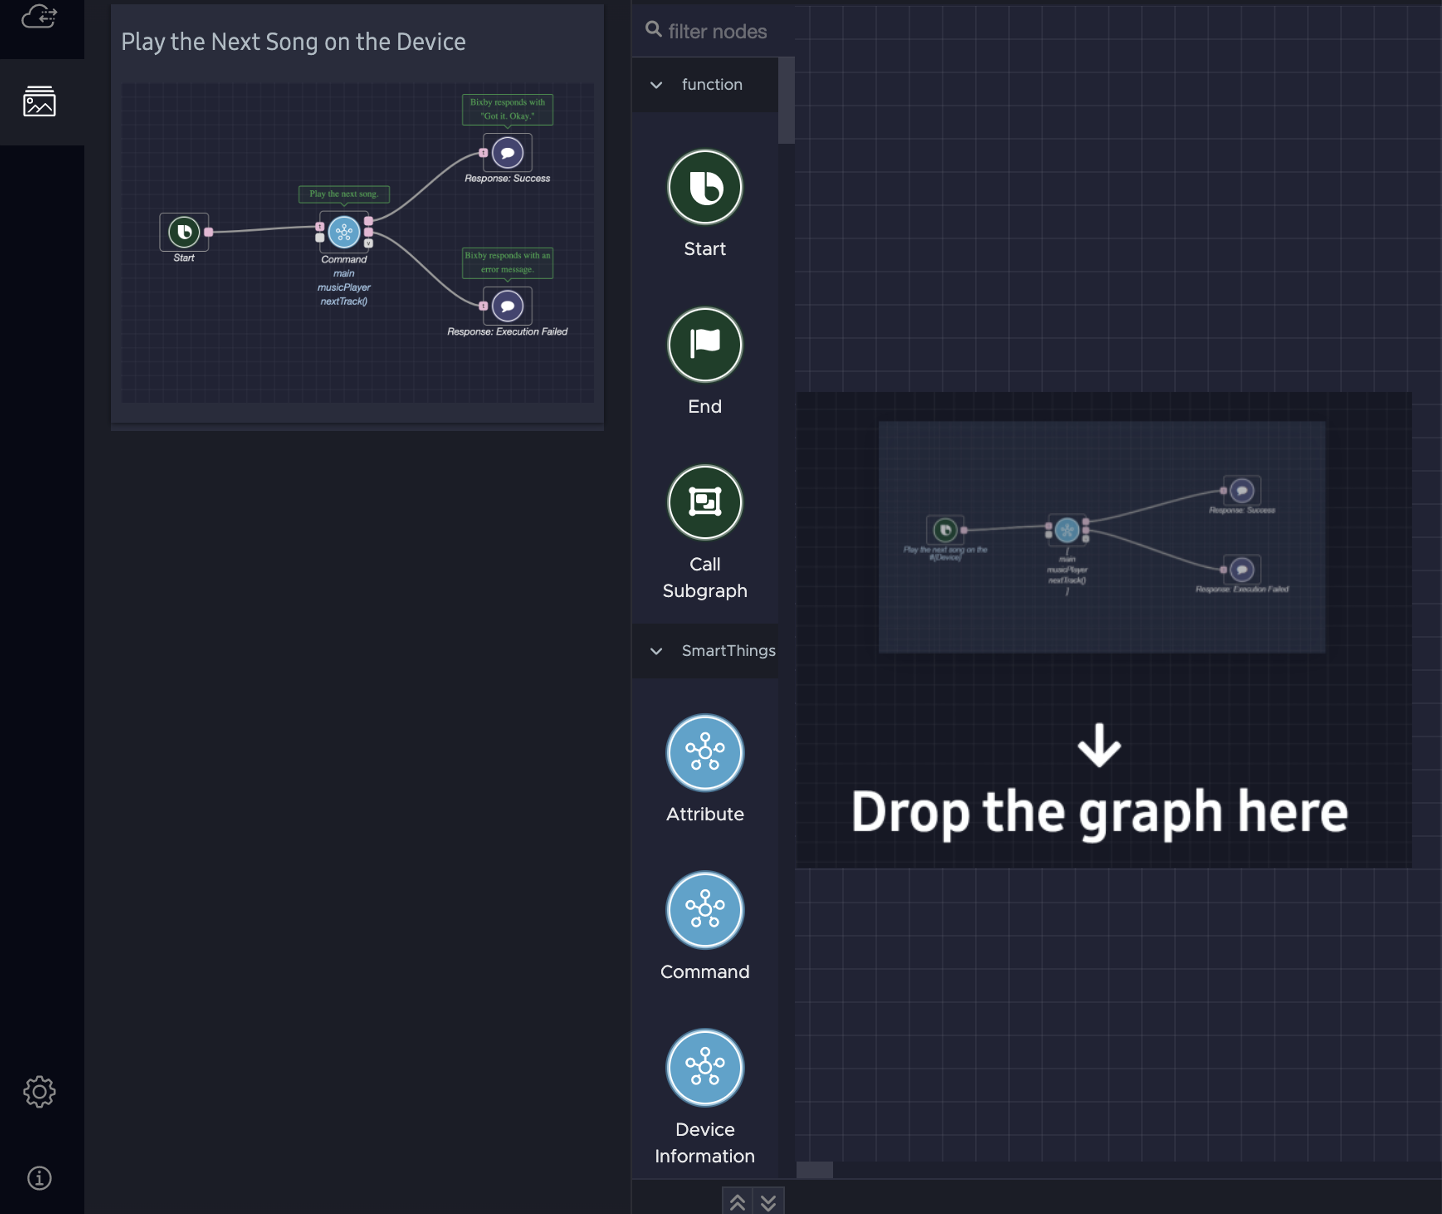
Once the graph has been added, the editor will inform you that the nodes were imported.
Your graph is now ready to use as-is or modify for your needs!